Introduction
School districts face a tough challenge: stretching limited resources across growing demands while ensuring every dollar advances student achievement.
With federal revenue accounting for just 12.9% of K-12 funding nationwide in FY2023, districts rely overwhelmingly on state and local sources—both vulnerable to economic swings and political pressures. Salaries and benefits consume about 79% of current expenditures, leaving little room for shortfalls or strategic investments.
This guide offers a practical framework for data-driven budgets that align resources with educational priorities, balance competing demands, and build fiscal resilience.
Key Takeaways
- Federal revenue supplies only 12.9% of K-12 funding; manage separate state and local revenue forecasts to account for volatility
- Personnel costs average 79% of current expenditures; model staffing and benefit changes before all other budget decisions
- Use GFOA's five-step framework to root every budget decision in instructional priorities, not available funds
- Maintain at least two months of operating expenses in fund balance and adopt clear board policies for use and replenishment
- Review budget performance monthly, reforecast quarterly, and implement formal midyear adjustments when assumptions change
Understanding School District Budget Fundamentals
Revenue Sources and Structure
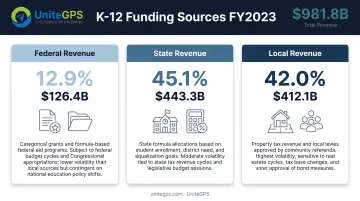
Public K-12 schools received $981.8 billion in total revenue during FY2023. Federal sources contributed $126.4 billion (12.9%), while state sources supplied $443.3 billion and local revenue provided $412.1 billion, together representing 87.1% of all funding. This distribution means districts operate under two different funding dynamics:
- Federal revenue flows through competitive grants, categorical aid, and formula programs tied to specific populations or compliance requirements
- State and local revenue depends on enrollment counts, property values, tax collection rates, and legislative formulas that vary widely by jurisdiction
Because state and local sources dominate, district budget planning must treat federal funding as supplemental, not foundational, and maintain separate forecast assumptions for each stream.
Essential Budget Terminology
Board members, administrators, and stakeholders rely on a shared vocabulary:
- Fund balance: Assets plus deferred outflows, minus liabilities plus deferred inflows; the equity position of a governmental fund
- Unassigned fund balance: Spendable General Fund amounts not committed, restricted, or assigned elsewhere (the true reserve cushion)
- FTE (full-time equivalent): Method for converting part-time positions to a full-time basis for staffing comparisons
- Deficit budget: Expenditures exceed regular, ongoing revenue in a fiscal year, requiring reserve drawdowns or one-time sources
- Revenue assumptions: Documented forecast inputs including sources, dates, ranges, and triggers for updating projections
Operating Realities: Cycle, Governance, and Personnel Costs
Districts manage three budget years simultaneously: closing out the prior year's financials, operating within the current year's appropriations, and planning next year's allocations. That overlap demands rigorous documentation, clear handoffs between fiscal years, and monthly tracking so planning assumptions stay tied to operational reality.
School boards provide policy direction, vision, parameters, oversight, and formal appropriation authority. Superintendents and administrative teams prepare detailed budgets aligned with board priorities, manage day-to-day execution, and present recommendations for board action. This division preserves democratic accountability while drawing on professional financial expertise.
Salaries and benefits account for 79% of current expenditures nationally—not 79% of total budgets, but 79% of operating spending after debt service and capital. Two implications follow:
- Budget flexibility exists almost entirely in the remaining 21% (supplies, contracts, utilities, transportation)
- Meaningful cost reduction or reallocation requires addressing compensation, benefits, or staffing ratios, which is politically difficult but mathematically unavoidable during revenue shortfalls
Key Components of Effective School Budget Planning
Strong school budgets rest on a few repeatable building blocks: a clear calendar, explicit assumptions, healthy reserves, honest spending analysis, a realistic tax-base picture, and peer benchmarks. Work through each one before you lock next year’s plan.
Comprehensive Budget Calendar
Map every key milestone from preliminary planning through board adoption. Minimum stages include:
| Calendar Stage | Milestone |
|---|---|
| Plan | Strategic goals, stakeholder map, enrollment baseline, multiyear forecast |
| Prepare | Revenue assumptions, staffing baseline, benefits, operating requests, capital plan, scenario cases |
| Review | Superintendent recommendation, board workshops, public materials and feedback |
| Adopt | Public hearing, statutory notices, board appropriation before fiscal-year start |
| Execute/Evaluate | Monthly status reports, quarterly forecast, formal midyear amendment, year-end close and audit |
State timelines vary, but most require budget adoption before the fiscal year begins. Starting preliminary work by January for a July 1 fiscal year is common practice.
Establishing Budget Assumptions
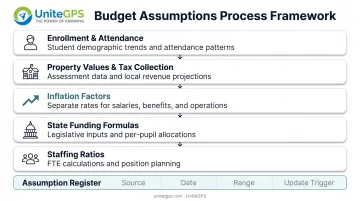
Document every major forecast driver explicitly:
- Enrollment and attendance trends: Historical three-year trend, projected demographic shifts, charter/choice impacts
- Property values and tax collection rates: Assessed values, appeal history, delinquency rates, jurisdiction-specific timing
- Inflation: Separate rates for compensation, benefits, utilities, fuel, contracts, and supplies
- State funding formulas: Legislative appropriations, per-pupil allocations, categorical aid, hold-harmless provisions
- Staffing ratios: Students per teacher, support staff per building, administrative span of control
Create an assumption register that identifies each input's source, date, range, and the trigger for updating. When assumptions change materially, formal budget amendments follow.
Analyzing Fund Balance Health
GFOA recommends maintaining at least two months of regular General Fund operating revenue or expenditures as a minimum reserve. Adjust that floor upward for revenue volatility, seasonal cash-flow needs, or limited borrowing capacity. Review fund balance trends over five years:
- Are reserves growing, stable, or declining?
- What percentage of annual spending does the unassigned fund balance represent?
- Does your district have a board-adopted policy stating permitted uses and replenishment timelines?
Effective policies prevent reserves from being treated as a slush fund while ensuring they're available for genuine emergencies.
Assessing Current Spending Patterns
Before planning new allocations, understand where resources currently go:
- Break down spending by function (instruction, support services, operations, debt)
- Analyze spending by department, program, and school site
- Calculate per-pupil costs and compare across schools with similar demographics
- Identify the largest budget line items and their growth trends over three years
This baseline analysis reveals whether spending aligns with stated priorities or simply reflects inertia.
Understanding Your Tax Base Composition
Tax bases vary by property class—residential, commercial, industrial, agricultural, and state-assessed utilities. Composition matters for revenue stability:
- Residential bases grow steadily but offer limited short-term upside
- Commercial/industrial bases can deliver significant revenue but concentrate risk
- Oil/gas or natural-resource bases introduce extreme volatility
Report each class's share, identify your top five taxpayers, and model explicit downside scenarios for concentrated revenue sources.
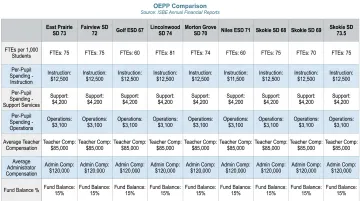
Conducting Peer District Comparisons
Select peer districts with similar demographics, academic performance, and labor markets. Compare:
- FTEs per 1,000 students and per building
- Compensation schedules and total compensation (salary plus benefits)
- Per-pupil spending by function and object
- Fund balance as a percentage of expenditures
Leave out positions that legal requirements or program design make noncomparable. Peer analysis surfaces competitive gaps and shows whether your costs reflect inefficiency or deliberate mission choices.
Best Practices for School District Budgeting
Effective district budgets tie every major allocation to student outcomes. These six practices, grounded in GFOA guidance, help finance teams set priorities, engage stakeholders, and adjust when conditions change.
1. Start with Clear Instructional Priorities
GFOA's framework places "Set Instructional Priorities" second in the five-step process (after planning, before funding). Root budget decisions in your district's strategic plan and student achievement goals.
Define 3-5 explicit priorities—such as "increase third-grade reading proficiency to 75%" or "reduce chronic absenteeism by 20%"—and require every funding request to show alignment.
2. Involve Stakeholders Early and Often
GFOA recommends surveys, focus groups, interviews, public hearings, town halls, advisory groups, and interactive priority tools. Quality engagement means:
- Begin before decisions are locked in
- Present common facts and trade-offs
- Include underrepresented groups deliberately
- Publish how input changed the final budget
Stakeholder input without visible impact breeds cynicism.
3. Develop Multiple Budget Scenarios
Prepare conservative, moderate, and optimistic scenarios:
- Conservative: Assumes enrollment decline, below-trend state funding, higher-than-expected benefit costs
- Moderate: Uses best available forecasts without optimistic adjustments
- Optimistic: Models upside enrollment, above-formula state aid, or cost efficiencies
Publish prioritized investments and cuts for each scenario, define decision triggers, and pre-rank actions so mid-year adjustments don't require starting from scratch.
4. Rank All Budget Requests by Priority
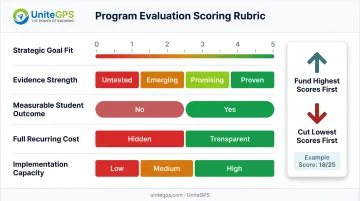
Require departments and schools to prioritize their requests using a scoring rubric:
- Strategic-goal fit (0-5 points)
- Evidence strength (proven, promising, emerging, untested)
- Measurable student outcome (yes/no)
- Full recurring cost (transparent, hidden)
- Implementation capacity (high, medium, low)
Fund the highest instructional scores first. When cuts are necessary, eliminate the lowest-scoring items rather than applying across-the-board reductions that penalize effective programs equally with ineffective ones.
5. Plan for Both Short-Term and Long-Term Needs
Start with a long-term financial plan, review it annually, and update when assumptions materially change. Balance two horizons:
- Short-term: Teacher salaries, supplies, utilities, and other operating costs
- Long-term: Facilities, technology infrastructure, and multi-year program development
Long-term plans prevent deferred maintenance crises and support phased rollout of major initiatives.
6. Build in Budget Flexibility and Contingency
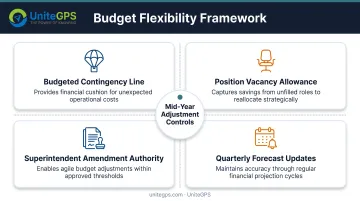
Create formal mechanisms for mid-year adjustments:
- Reserve a budgeted contingency line (distinct from your fund balance policy)
- Include a position vacancy allowance recognizing not all positions fill immediately
- Grant the superintendent limited amendment authority for reallocations below a board-defined threshold
- Schedule quarterly forecast updates so the board receives early warnings
These controls allow operational flexibility without sacrificing oversight.
Aligning Budget with Student Achievement Goals
Ensure your largest expenditures directly support your highest-priority goals. If improving third-grade literacy is priority one, your budget should show specific allocations for reading intervention, literacy coaches, assessment tools, professional development, and extended learning time, not generic increases.
Evaluate programs using measured student outcomes, not just inputs. For each major program, document:
- Target students and baseline performance
- Evidence base (research-backed, promising, untested)
- Per-participant cost
- Implementation fidelity measure
- Near-term indicator (attendance, grades, test scores)
- Continue/modify/stop decision date
Wichita Public Schools reported allocating approximately 87% of its 2025-26 budget directly to classrooms, with the remainder funding facilities maintenance, business support, and administration. The budget also funded counselors, social workers, psychologists, and family engagement, showing that "classroom" spending includes the full ecosystem supporting students.
That same discipline applies when something is not working. Redirect resources from lower-performing initiatives only after reviewing implementation quality and identifying stronger replacement evidence. Avoid abandoning sound programs that suffered from poor execution.
Budget Communication and Stakeholder Engagement
Clear communication turns a complex budget into decisions boards and communities can stand behind. Lead with visuals, plain language, and honest trade-offs.
Presenting Budgets to School Boards
Use clear visuals and simplified explanations:
- One-page sources-and-uses summary
- Staffing/FTE bridge showing changes from prior year
- Fund-balance bridge
- Multi-year forecast
- Scenario comparison table
- Capital versus operating split
- Spending-to-outcome map linking dollars to instructional priorities
Emphasize the connection between spending and student outcomes. Board members approve budgets more confidently when they understand how allocations advance achievement goals.
Building Community Understanding and Support
Publish accessible formats:
- Budget-in-Brief (2-4 pages, plain language)
- Dedicated budget webpage with downloadable data
- Interactive dashboards showing spending by school, program, or function
- Public financial and performance reports
Transparency is only the starting point. Interpretation builds support. Explain why certain costs are unavoidable (special education mandates, pension contributions) and where the district exercises discretion.
Addressing Competing Stakeholder Demands
Stakeholders will push competing priorities: smaller class sizes, higher teacher salaries, more counselors, expanded athletics, and technology upgrades. Make trade-offs explicit so advocates see the real cost of each ask.
For example: "Reducing class sizes by two students costs $1.2 million. Would you fund this by eliminating the middle school athletics program or increasing property taxes by 3%?"
Return final decisions to adopted instructional priorities as the guiding framework. When priorities conflict with popular demands, the board must either reaffirm priorities or formally change them, but not ignore them.
Monitoring and Adjusting Your School Budget Throughout the Year
A board-approved budget is a starting plan, not a finished one. Enrollment shifts, delayed aid, and cost spikes show up midyear—and districts that catch them early protect both programs and reserves.
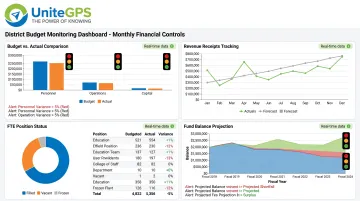
Many states expect formal in-year oversight. Washington, for example, requires monthly budget-status reports on revenues and expenditures. Minimum monthly controls include:
- Budget/actual/encumbrance/forecast by fund and function
- Revenue receipts versus projection
- Payroll and FTE versus authorized positions
- Cash balance and projected reserve
- Variance owners and corrective actions
Pair those reports with early warning indicators so small variances trigger action before they become structural gaps:
- Enrollment or attendance below forecast
- Revenue shortfalls (delayed state aid, weak tax receipts, or lower assessed values)
- Salary, benefit, or overtime variance
- Procurement inflation
- Cash drawdown rate
- Recurring costs funded by one-time revenue
When indicators flip, a structured midyear review turns data into board-ready decisions. Fairfax County Public Schools approved its formal midyear review on December 19, 2024. School Operating Fund resources rose $3.8 million, mainly from actual sales-tax receipts and class-action settlement funding. Expenditure adjustments supported esports stipends, an iTeach licensure pathway, and safety and security work—preserving instructional workforce capacity without breaking fiscal balance.
Midyear reviews also surface where operations can absorb pressure without cutting classrooms. Transportation is often one of those levers: route optimization and fleet management tools reduce fuel and labor waste so dollars can move back toward instruction.
Frequently Asked Questions
What are the 5 basic elements of a budget?
A school budget includes revenue projections (federal, state, local), expenditure allocations by function and object, prior-year ending fund balance, required reserves, and contributions or transfers between funds. Together these form a complete financial plan.
What are the 7 steps in the budget process?
The cycle typically covers planning and prep, stakeholder input, draft development, board review and revision, formal presentation, adoption before the fiscal year, and ongoing monitoring with mid-year adjustments.
What are common types of school district budgeting?
Common approaches include incremental, zero-based, site-based, program-based, performance-based, and priority-based budgeting. Modified accrual is an accounting basis, not a budgeting method.
How can school districts reduce operational costs while maintaining quality?
Optimize bus routes, use energy management and preventive maintenance, and buy through cooperatives for better pricing. Technology that automates tracking and cuts duplicate data entry also trims overhead without hurting service quality.
What percentage of a school budget should go to instruction vs. operations?
Districts often put about 60-65% of current spending toward instruction and 30-35% toward operations and support. Those figures are national averages, not targets—how well programs work matters as much as the split.
How often should school districts review and adjust their budgets?
Run monthly reviews of revenue, spending, and fund balance against plan, plus quarterly reforecasts of enrollment and year-end balance. Use formal mid-year amendments when variances exceed board thresholds (often 2-5% of the total budget).