 for Efficiency](https://file-host.link/website/unitegps-qtixtb/assets/blog-images/f68e0134-45d9-49f2-8f29-ae4b7be338ca/1787208130109922_439db743d23e41e38cb2b13ad271f19f/360.webp)
Introduction
More than 25 million students ride over 480,000 school buses across the United States each day. Behind those numbers lies a tough operational challenge: thousands of students across growing districts, limited fleets, 199,000 drivers nationwide still 12.2% below pre-pandemic levels, and transportation budgets stretched thin.
Every morning and afternoon, districts must run this system with precision—or face late buses, frustrated families, and mounting costs.
Route optimization addresses far more than budget pressure. Done well, it cuts student ride times, improves stop safety, reduces fuel consumption, and gives parents predictable arrival information. Yet many districts still rely on decades-old manual routing, missing chances to reclaim hundreds of thousands (or millions) in annual savings while improving service quality.
This guide covers how to optimize school bus routes for efficiency—what data you need, which practices move the needle, and how modern routing tools help districts cut cost without cutting service.
Key Takeaways
- Current data, routing software, and operational strategy together cut fleet needs without sacrificing service
- Boston Public Schools eliminated 50 buses and saved $5 million annually after implementation
- Accurate student records, leadership support, the right routing tools, and flexibility on stops and schedules drive results
- Districts typically see measurable fleet, cost, and mileage reductions within the first implementation year
How to Optimize School Bus Routes
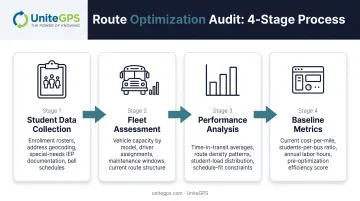
Step 1: Audit Your Current System and Gather Data
Start with a complete picture of your operation. Gather data in three areas:
- Students: address, school assignment, transportation eligibility, special-needs accommodations, and current stop with pickup and drop-off times
- Fleet: bus types, seat counts, wheelchair accessibility, and driver availability by tier
- Performance: late buses, route duration, total miles driven, and cost per transported student
Identify pain points through direct conversations with drivers and review parent complaints. Common issues include:
- Ride times exceeding 45–60 minutes
- Buses running consistently late
- Some routes near capacity while others run half-empty
- Stops placed in unsafe locations or requiring excessive walk distances
Establish baseline metrics now (total buses used, average ride time, on-time percentage, and annual cost) so you can prove the value of changes later.
Step 2: Consolidate and Strategically Place Bus Stops
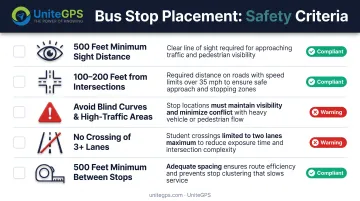
Review your current stop density. Missouri's Department of Education recommends stops be no less than 500 feet apart, based on amber-light activation distance. Consolidating stops reduces route time and mileage, but balance efficiency against accessibility for younger students, special-needs families, and those without transportation.
Prioritize safety when evaluating stop locations:
- Avoid high-traffic intersections, blind curves, and locations requiring students to cross major roads
- NHTSA recommends at least 500 feet of straight-line sight distance and placement 100–200 feet from intersections on roads above 35 mph
- Use mapping tools to evaluate sight lines, speed limits, and traffic patterns
- Never require students to cross three or more lanes
Communicate changes early to families, explaining the safety and efficiency benefits of consolidated stops. Geographic clustering helps group students logically while minimizing walk distances.
Step 3: Design Efficient Routes Using Optimization Principles
Apply sequencing logic that minimizes backtracking and unnecessary miles. NHTSA data shows left turns were the leading pre-crash event in 22% of crashes versus just 1.2% for right turns. Prioritize right turns and avoid routes that require buses to back up. Modern routing software can test thousands of combinations to find strong sequences, but local knowledge still matters for real-world constraints.
Balance capacity utilization across routes. Aim for load levels that leave buffer for enrollment swings and special circumstances. Avoid packing every bus to the maximum with no room for new students or substitute drivers.
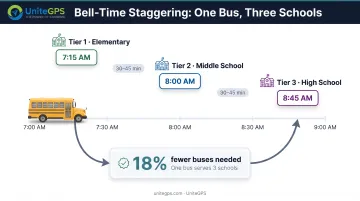
Consider bell-time staggering to enable bus reuse. Spreading start times by 30–60 minutes lets one bus serve multiple schools and reduces fleet size. Boston's model showed the district could run 530 buses instead of a 650-bus manual baseline (an 18% reduction). Family resistance delayed broader bell-time changes, so the district started with a more modest 50-bus (8%) cut in year one, saving $5 million annually.
Account for special constraints including wheelchair-accessible routes, IEP-mandated services, behavior plans requiring specific seating, and hazardous walking conditions. These requirements must be incorporated into route design, not treated as afterthoughts.
Step 4: Test, Implement, and Continuously Refine
Run simulations before go-live. Validate timing, identify schedule conflicts, and stress-test your plan against scenarios like traffic delays, substitute drivers, and severe weather. If possible, implement changes in phases—start with one tier or geographic area, gather feedback, make adjustments, then expand district-wide.
Provide drivers with clear route sheets, turn-by-turn directions, updated stop lists, and GPS navigation tools that offer real-time guidance and can reroute around unexpected road closures. UniteGPS Crosswalk K-12 includes both printable step-by-step directions and tablet-based turn-by-turn navigation with audible guidance, helping substitute drivers follow unfamiliar routes consistently.
Monitor performance closely in the first few weeks:
- Track actual versus planned arrival times
- Collect feedback from drivers about route feasibility and stop safety
- Document parent concerns and identify patterns
- Make rapid adjustments before issues become entrenched problems
Expect some parent resistance initially. Most concerns subside as new routines become familiar, especially when you've communicated benefits like shorter ride times and safer stops upfront.
When Should You Optimize School Bus Routes
Route optimization is not a one-time project. Build it into your calendar, and move faster when operations, enrollment, or policy shift.
Ideal Timing and Triggers
Annual optimization belongs before each school year starts, once enrollment is finalized. That window is when you fold in address changes, new students, and program adjustments.
Some states treat this as a compliance deadline. Indiana requires route and safety-policy review each September 1, and Ohio mandates annual safety audits of routes, stops, and loading sites.
Optimize immediately when you face:
- Budget cuts requiring fleet reduction
- Significant enrollment shifts from school closures or redistricting
- Persistent parent complaints about ride times and chronic late buses
- New school openings or major facility changes
- Bell-time adjustments or transportation policy changes
- School-choice programs that change attendance boundaries
Warning signs you need optimization now:
- Buses consistently running late despite adequate staffing
- Some routes near capacity while others are half-empty
- Ride times regularly exceeding 45–60 minutes
- High fuel costs relative to peer districts
- Inability to cover all routes due to driver shortages
What You Need Before Optimizing Routes
Successful optimization requires the right data, tools, and organizational support. Trying to optimize without these elements leads to suboptimal results—or outright failure.
Accurate and Complete Data
Maintain an up-to-date student information system that includes:
- Current addresses and school assignments
- Grade levels and transportation eligibility
- Special-needs accommodations that affect routing
Document operational constraints as well:
- Bus capacities by vehicle number
- Driver certifications and availability
- Maintenance schedules and bell times by school
- Student-specific requirements mandated by IEPs
Appropriate Routing Technology
Evaluate school bus routing software that can handle your district's complexity. Core features to look for include:
- Stop optimization and automatic route generation
- What-if scenario modeling
- Bell-time coordination
- SIS integration that syncs enrollment changes automatically
Decide whether basic routing is enough or whether you also need GPS tracking, parent notification apps, tablet-based ridership tracking, and turn-by-turn navigation for drivers.
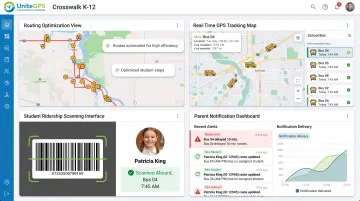
Integrated platforms like UniteGPS Crosswalk combine routing, real-time GPS (location updates every five seconds), student ridership scanning, parent communication, and driver tablet tools in one system. Districts can run operations without juggling multiple vendors. UniteGPS also offers a no-cost route optimization study and builds initial routes at no charge during a 90-day free trial.
Leadership and Stakeholder Buy-In
Secure commitment from district leadership that efficiency improvements matter more than maintaining the status quo. Route changes will generate parent complaints, and administrators need to stand behind operational improvements when families push back.
Develop a parent communication plan that explains why changes are necessary and how they improve safety and efficiency. Give advance notice of stop changes, new pickup times, and route adjustments, and tie each change to a clear benefit such as shorter ride times or better on-time performance.
Common Mistakes When Optimizing School Bus Routes
Even solid optimization plans stall when districts hit the same avoidable traps. Watch for these:
- Optimizing routes without coordinating bell times. If every school starts together, you can't reuse buses across tiers and you miss the biggest fleet-reduction lever. Bell-time staggering is often the highest-impact change a district can make.
- Loading routes to 100% with no buffer. That leaves no room for new students, simpler sub-driver runs, or special circumstances. Keep a reasonable capacity cushion instead of maxing every route.
- Chasing fleet cuts while ignoring ride time and stop safety. A plan that saves buses but creates 90-minute rides or unsafe stops draws backlash and rarely holds. Balance efficiency with service standards.
- Rolling out big changes without early communication. New stops and times disrupt family routines. Springing them a week before school starts creates avoidable conflict—start early, explain why, and offer a feedback channel.
- Building on incomplete or inaccurate data. An audit of Jefferson County Public Schools' 2023 routing failure found thousands of omitted stops, ignored staff warnings, and no review of special-education needs. Algorithms need complete data, thorough testing, and operational review before go-live.
Measuring Success and Continuous Improvement
Track quantifiable metrics to evaluate whether optimization delivered expected results:
- Total buses used (fleet size reduction)
- Cost per student transported
- Average and maximum ride times
- On-time performance percentage (define your district's on-time window first)
- Parent complaint volume
- Fuel consumption and total miles driven
Pair those numbers with qualitative feedback from the people who live the routes every day:
- Drivers on route feasibility and timing
- Parents on service satisfaction
- School staff on arrival and dismissal flow
Metrics alone won't surface every operational issue.
Treat optimization as ongoing work, not a one-time project. Student populations shift, roads close for construction, and new developments appear. Continuous refinement captures more efficiency gains while you hold service quality steady.
Review routes quarterly and run a full optimization annually so plans keep pace with changing conditions.
Frequently Asked Questions
Can AI do school bus route optimization?
Yes. AI and advanced algorithms can evaluate thousands of routing options far faster than manual planning. Boston's algorithm produced a system route map in 30 minutes that previously took thousands of hours from ten human routers. Results are strongest when human expertise still guides local constraints, special needs, and community priorities.
Can Google Maps show bus routes?
Google Maps offers driving directions and traffic data useful for planning, but it does not optimize school bus routes or manage capacity, student assignments, stop sequencing, bell times, or special-needs and safety rules. Dedicated school bus routing software pairs mapping with transportation-specific optimization that general navigation tools cannot provide.
How much can route optimization reduce transportation costs?
Results vary by district. Boston Public Schools cut 50 buses from a 650-bus fleet (about 8%) and saved $5 million in the first year, while driving 1 million fewer miles annually. Your savings depend on baseline efficiency, geography, bell schedules, and service constraints.
How long does it take to implement optimized routes?
Plan on data collection and analysis (2–4 weeks), route design and simulation (2–3 weeks), stakeholder communication (2–3 weeks), and driver training (1 week). Full rollout usually takes 2–3 months from decision to first day, so start in spring for fall. Boston saw fleet, cost, and mileage gains in its first implementation year.
What if parents complain about new stops or pickup times?
Explain benefits clearly (safety, shorter rides, savings reinvested in schools) and offer a channel for legitimate concerns while holding firm on system-wide improvements. Boston delayed broader bell-time proposals after family protests, underscoring early stakeholder engagement. Most resistance fades within a few weeks as new routines settle.
Do we need to optimize routes every year?
Yes. Review and re-optimize before each school year for enrollment changes, new housing, and continuous improvement. Limit mid-year changes to major events such as new schools, large enrollment shifts, or safety issues so established routines stay stable.