Key Takeaways
- Per-student transportation costs typically range from under $1,000 to over $1,500 a year by district size and geography
- Driver pay is the largest cost driver, followed by fuel, depreciation, maintenance, insurance, and technology
- Rural districts pay more per student due to longer routes and lower density than urban districts
- Route optimization software can cut total route miles by 15–20%, reducing fuel and driver-time costs
How Much Does School Bus Transportation Cost Per Student?
Per-student transportation costs vary widely with district size, student density, and region. Transportation directors use these benchmarks to compare spending and find where costs can come down.
National Average Per-Student Cost
The most current verified national average is $1,152 per student transported for the 2018-19 school year, published by NCES. This figure includes all transportation expenses (vehicles, fuel, drivers, maintenance, insurance, and administration) divided by the number of students who actually ride.
Over the past decade, per-student costs have increased due to several factors:
- Rising school bus driver wages driven by nationwide labor shortages
- Higher vehicle acquisition costs, particularly for alternative-fuel buses
- Increased fuel prices and volatility in diesel markets
- Growing investment in GPS tracking and route optimization technology
- Expanded safety and compliance requirements
The NCES data series does not include more recent years, making 2018-19 the latest verified national benchmark. Individual districts should compare their current costs to state and regional peers rather than relying solely on this older national figure.
Cost Range by District Type
District characteristics create dramatic variation in per-student transportation expenses:
Small rural districts typically face the highest per-student costs. Pennsylvania data from 2013-18 showed rural districts averaging $984 per pupil transported compared to $953 statewide. Rural challenges include:
- Longer average route distances with fewer students per mile
- Lower student density requiring more buses to serve scattered populations
- Higher per-mile operating costs due to extended travel times
- Difficulty achieving full bus capacity on long, sparsely populated routes
Suburban districts often land in the middle. Routes run shorter than rural runs, and neighborhoods are dense enough to fill buses without the stop-and-go congestion common in cities.
Urban districts often lower per-student costs through density. The same Pennsylvania study found urban districts averaging $941 per pupil transported. Shorter routes, higher ridership per bus, and tighter stop clustering cut costs, though traffic and complex scheduling can erase part of those savings.
State-by-State Variation
Geographic location, population density, and state funding models create significant interstate differences. While current per-student-transported data by state is not available through NCES, U.S. Census Bureau fiscal data shows wide variation in transportation spending per enrolled pupil across states.
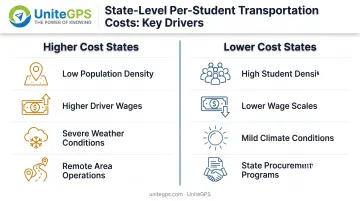
States with higher costs typically share characteristics such as:
- Low population density requiring longer routes
- Higher driver wage scales and benefits
- Severe weather requiring additional equipment and service adjustments
- Higher fuel and operating costs in remote areas
States with lower costs often benefit from:
- Higher student density allowing efficient route consolidation
- Lower regional wage scales
- Milder climates reducing weather-related costs
- State-level procurement programs achieving vehicle cost savings
Compare your numbers to your state's funding model and to peer districts so budget targets stay realistic and efficiency work focuses where similar systems already spend less.
What Drives Per-Student Transportation Costs?
Per-student costs equal total operational expenses divided by ridership. Anything that changes total spending or the number of students transported moves that average, so cost control has to address both sides of the equation.
Vehicle Acquisition and Depreciation
School bus purchase prices range from $80,000 to $180,000 depending on size, capacity, and fuel type. Districts typically amortize these costs over a 12-15 year vehicle lifespan.
For example, a $150,000 bus serving 60 students over 12 years contributes about $208 per student per year in vehicle cost alone ($150,000 ÷ 12 years ÷ 60 students).
Electric buses cost more upfront but usually run cheaper over their life through lower fuel and maintenance. Exact savings still depend on local electricity rates and duty cycles.
Fuel and Energy Costs
Fuel costs vary by fuel type, route length, and local prices. Diesel is still the most common source, and prices move with the market. Propane, compressed natural gas (CNG), and electricity each carry a different cost profile.
Electric buses eliminate diesel fuel entirely but require infrastructure investment and careful consideration of electricity rates and charging schedules. Route length and fuel efficiency directly impact per-student costs; districts that reduce total route miles through optimization see proportional fuel savings.
Driver Compensation and Benefits
Driver costs consistently represent the largest single expense category in school transportation budgets. The U.S. Bureau of Labor Statistics reports a national median annual wage of $47,040 for school bus drivers in May 2024, with regional variation based on cost of living and labor market conditions.
Total driver compensation includes:
- Base wages or hourly rates
- Benefits packages (health insurance, retirement contributions)
- Paid training time
- Overtime for extracurricular trips
- Substitute driver coverage
Nationwide driver shortages have pushed wages upward in many markets, directly impacting per-student costs. Districts with efficient routes require fewer driver hours to serve the same student population, spreading these fixed costs across more riders.
Maintenance and Repairs
Vehicle maintenance costs vary by fleet age, fuel type, and operating conditions. Older buses require more frequent repairs, while newer vehicles stay under warranty longer. Harsh weather, rough roads, and extended route distances accelerate wear and increase maintenance expenses.
Regular preventive maintenance reduces catastrophic failures but still needs technician time and parts inventory. Districts lower per-student maintenance costs by right-sizing the fleet so spare buses are not sitting idle and still drawing upkeep. Replacing aging buses before repair bills spike has the same effect.
Route Efficiency and Utilization
Route optimization directly impacts per-student costs by maximizing students per bus and minimizing miles driven. A district that reduces total route miles by 15% through optimization lowers fuel consumption, vehicle wear, and driver time proportionally.
For example, Boston Public Schools' routing algorithm produced a system-level route map described as 20% more efficient than hand-built routes. The application delivered $5 million in yearly savings while maintaining service quality with 50 fewer buses.
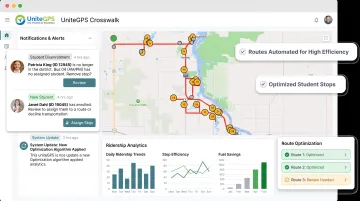
Modern routing software like UniteGPS Crosswalk helps districts optimize routes by:
- Automatically identifying shorter, safer paths across the fleet
- Balancing bus loads to avoid overextended routes
- Tracking actual ridership to eliminate underutilized stops
- Recalculating schedules instantly when students move or change schools
Better route efficiency cuts the cost side of the per-student equation. The same students ride with fewer buses and driver hours, and fuel and maintenance drop at the same time.
Administrative and Technology Costs
Transportation management requires dedicated staff, routing software, GPS tracking systems, student information system (SIS) integration, and ongoing technology support. While these costs add to the budget, technology investments often reduce long-term per-student expenses through operational efficiency.
Well-chosen tools usually pay back through operations, not just reporting:
- Automated routing cuts hours of manual schedule work
- SIS integration removes duplicate data entry
- GPS tracking answers parent questions in real time and trims office call volume
Those gains show up as fewer labor hours and fewer avoidable miles—the same levers that pull per-student cost down.
Per-Student Cost Breakdown
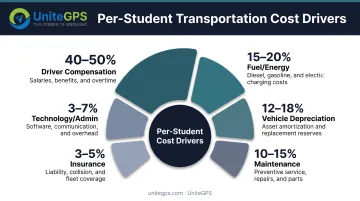
Total transportation spending breaks into several cost categories. Exact shares vary by district size, geography, and operational model, but typical annual per-student components look like this:
| Cost Category | Typical Share of Total |
|---|---|
| Driver compensation | 40-50% |
| Fuel/energy | 15-20% |
| Vehicle depreciation | 12-18% |
| Maintenance and repairs | 10-15% |
| Insurance | 3-5% |
| Administrative and technology | 3-7% |
| Other expenses | 2-5% |
Important note: These ranges reflect industry patterns, not verified national averages. Your breakdown will depend on local wages, fuel prices, fleet age, route efficiency, and technology use.
Transportation directors should build their own component mix from actual expense data for planning and benchmarking.
How to Calculate Your District's Per-Student Transportation Cost
Accurate calculation requires including all transportation expenses, not just obvious costs, and counting students who actually use transportation services.
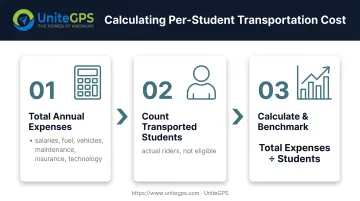
Step 1: Total Your Annual Transportation Expenses
Capture every cost category so your per-student figure reflects the full program:
Direct operating costs:
- Salaries and benefits: Driver, mechanic, dispatcher, and office wages, plus insurance, retirement, and payroll taxes
- Fuel and energy: Diesel, propane, CNG, or electricity for all transportation-related vehicles
- Vehicle purchases or lease payments: Annual depreciation or lease costs for active buses
- Maintenance and repairs: Parts, labor, preventive maintenance, and emergency repairs
- Insurance: Liability, collision, and comprehensive coverage for the fleet
Support and overhead:
- Technology and software: Routing platforms, GPS tracking, parent communication apps, and SIS integration
- Facilities: Bus garage rent or depreciation, utilities, and equipment
- Administrative overhead: Central office allocation for HR, purchasing, and financial support
Critical: Include indirect costs like facilities depreciation and central office support, not just direct transportation-department expenses. Omitting these items artificially lowers your calculated per-student cost.
Step 2: Determine Your Transported Student Count
Use the number of students who actually use transportation rather than all enrolled students or those eligible for service.
Many districts discover that their eligible count exceeds actual daily ridership by 10-20%. Parents may drive students, neighborhoods may be within walking distance, or high school students may choose other transportation. Using an inflated denominator understates your true per-student cost.
Best practice: Track actual daily ridership through:
- Driver-reported boarding counts
- Barcode or card-swipe ridership tracking systems
- GPS-verified stop activity
- Student transportation databases
Average your ridership count over the full school year to account for seasonal variation and enrollment changes.
Step 3: Calculate and Benchmark
Divide total annual expenses by transported student count to get your per-student cost:
Per-Student Cost = Total Annual Transportation Expenses ÷ Students Actually Transported
Compare your result to:
- State averages for districts of similar size
- Regional peers with comparable geography (rural, suburban, or urban)
- Previous years' internal performance to track improvement trends
If your per-student cost exceeds comparable districts by 15% or more, investigate specific categories such as driver hours, route miles, fuel consumption, or fleet size to identify efficiency gaps.
Ways to Reduce Per-Student Transportation Costs
Cost reduction comes from increasing efficiency and utilization rather than cutting safety or service quality. The most effective strategies improve operations while maintaining or enhancing student safety.
Optimize Routes and Schedules
Route optimization software identifies inefficiencies that manual planning misses. Automated tools analyze student addresses, school bell times, road networks, and bus capacity simultaneously to create shorter, more efficient routes.
Boston Public Schools achieved $5 million in yearly savings through route optimization, showing what systematic route planning can deliver. Results vary by district, but even a 10-15% cut in total route miles produces meaningful fuel and driver-time savings.
Route optimization helps districts:
- Eliminate redundant coverage and inefficient routing patterns
- Balance bus loads to avoid under-capacity and over-extended routes
- Adjust schedules automatically when students move or change schools
- Reduce total fleet miles without reducing service coverage
GPS tracking, ridership data, and automated routing also cut daily admin work. Districts can monitor live bus locations, track fuel use and idle time by vehicle, automate parent updates, and generate mileage and ridership reports for state reimbursement.
UniteGPS Crosswalk handles automated route optimization—shorter paths, balanced loads, and instant stop-time recalculation when stops change—plus GPS-verified mileage, idle and speeding alerts, and ridership tracking that shows who actually boards. That pairing removes hours of manual schedule work and gives transportation teams hard data for ongoing cost control.
Right-Size Your Fleet
Many districts operate more buses than actual ridership requires. Tracking actual daily boardings, rather than assuming all eligible students ride, reveals opportunities to consolidate routes and reduce the active fleet.
Right-sizing strategies include:
- Analyzing ridership patterns to identify underutilized routes
- Combining routes with low student counts when service levels permit
- Retiring excess buses to eliminate maintenance, insurance, and storage costs
- Deploying smaller vehicles on low-volume routes
Caution: Right-sizing must preserve service quality and safety. Overcrowding buses or extending ride times beyond acceptable limits undermines the benefits of fleet reduction.
Invest in Fuel-Efficient or Alternative-Fuel Vehicles
Alternative-fuel buses (propane, CNG, or electric) offer different lifetime cost profiles than traditional diesel. Upfront costs vary, but operating expenses can be much lower depending on local fuel prices and infrastructure.
Electric buses eliminate diesel fuel entirely and reduce maintenance costs by minimizing moving parts. The EPA's Clean School Bus Program provides $5 billion over FY2022-26 to replace existing buses with zero-emission and clean school buses. Federal grants can offset higher electric-bus purchase prices, improving the lifetime return on investment.
When evaluating alternative fuels, consider:
- Total cost of ownership over 12-15 years, not just purchase price
- Local fuel or electricity rates and price stability
- Available infrastructure (charging stations, fueling depots)
- Maintenance cost differences and technician training requirements
- Federal and state grant opportunities that reduce acquisition costs
Conclusion
Per-student transportation costs are the most meaningful metric for evaluating and planning school transportation budgets because they connect total spending to the number of students actually served. Those costs still vary widely, from under $1,000 to over $1,500 per student each year, depending on geography, how efficiently routes run, and district size and layout. Benchmarking against similar districts keeps budget targets realistic.
Districts can lower per-student costs with tighter routes, better data, and targeted technology—without cutting safety or service. Track who actually rides, fix inefficient runs, and use a platform like UniteGPS for routing and ridership visibility so directors can act on real numbers instead of estimates.
Frequently Asked Questions
How much does a standard school bus cost?
New school buses typically cost $80,000 to $180,000 depending on size, capacity, and fuel type. Electric models cost more upfront but usually cost less to run over time. Purchase price is only one piece of per-student costs; driver wages, fuel, and maintenance often dominate annual spending.
Who pays for school buses?
School transportation is funded mainly through state and local education budgets, and the mix varies widely by state. Some states use dedicated per-pupil transportation aid; others fold it into general operating funds. Federal grants, including the EPA's Clean School Bus Program, can help replace older buses with cleaner models.
What is the average cost to transport one student per year?
The most recent verified national average is $1,152 per student transported (2018–19 NCES data). That figure covers vehicles, drivers, fuel, maintenance, insurance, and administration divided by students who actually ride. Rural districts typically spend more because of longer routes and lower density.
Why do per-student transportation costs vary so much between districts?
Geography, student density, driver wages, and how routes are run drive most of the spread. Rural districts face longer routes and fewer riders per bus, which pushes per-student costs up. Urban districts gain from density but deal with congestion; route optimization and accurate ridership tracking still create real gaps between similar districts.
How can school districts reduce per-student transportation costs?
Districts cut costs by optimizing routes, right-sizing fleets to actual ridership, choosing more efficient vehicles, and using technology to tighten day-to-day operations. Boston Public Schools saved $5 million a year through systematic route optimization, a clear example of what data-driven changes can deliver.
What percentage of a school district's budget goes to transportation?
Transportation typically accounts for 3–5% of total K-12 spending nationally. Rural districts with long routes may spend 8–10% or more, while denser urban districts often fall below that average.